What Is Important When
Choosing Surge Protection
Pass Voltage: This is
probably the most important specification since this tells the amount of
voltage the equipment you are trying to protect will see after the surge
protector has done its job. These ratings are in peak volts which are not
the same as outlet voltage. If you wish to convert peak to RMS (outlet
voltage), multiply peak by .707. The ANSI test given to surge suppressors
that cause the most damage to equipment is called a Category B impulse
which is 6,000 V 1.2 x 50 microseconds, 3,000 amp 8 x 20
microseconds. This is actually a bi-wave or two waves combined, the voltage
at one time frame and the current at another. The 1.2 micro second refers
to the rise time or how fast it builds to maximum. The 50 refers to how
long it takes to decay to half power. The same applies to 8 x 20
microseconds, as the current is the deciding factor of damaging effect.
How to Read and Understand a Surge
Suppressor Test_____________________________________________
The ability of a surge suppressor to
reduce an over-voltage can be measured by testing. This performance testing
by the manufacture is performed with certified test equipment. We use a
Key-Tek Model 711 BK surge generator and measure the test results with a
Tektronix Model 2430 Oscilloscope. The results are printed by a Hewlett
Packard jet printer. To understand the test results as shown
to the right, you should know the surge generated at a specific voltage,
amperage and for a specific time interval. The test voltage is 6,000 volts. The test
amperage is 3,000 amperes. The time of the impulses is measured in
microseconds (1 ps = I millionth of a
second). The voltage and amperage are applied in what is termed a bi-wave
impulse, or at the same time. The
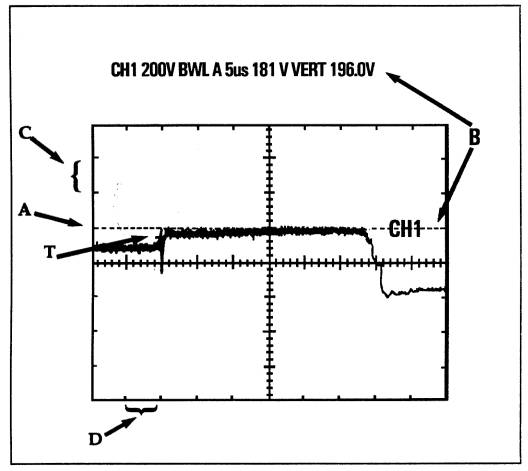
ANSI/IEEE “B3” impulse is: 6,000V for 1.2x 50 microseconds and 3,000 A for 8 x 20 microseconds. The picture is an actual example captured
by the oscilloscope as shown on its screen. The dotted line “A” is a
movable voltmeter built in the oscilloscope. When this line is placed upon
the peak of the surge voltage recorded by the oscilloscope, the “peak” pass
voltage of the surge suppressor is shown at the top of the screen. This
point is marked on the test as “B”. In the print above,
each increment going up or down is equal to 200 volts (marked as “C”). Each increment going from
left to right is the time measured in increments of 5 microseconds (marked
at “D”). The “T” shown on the print is the trigger point or where the
impulse (surge) started. Oscilloscopes
measure in peak-to-peak volts. To convert this to normal outlet voltage
(115-120AC), you need to convert the measured “peak-to-peak” volts to RMS
(root mean squared) voltage. Normal outlet voltage, when
measured in peak volts, is approximately 170 VPP> Example Calculation: 196 Volts (peak) x .707 = 138.57 Volts (RMS) The above
test example shows the Model 3NF has a RMS pass voltage of 138.57 volts.
____________________________________________________________________________________________________________________________________________
4
Surge Suppressor